Dashboards
This section contains information on the VidyoInsights dashboard.
To help you better understand usage, activity, and licensing, VidyoInsights aggregates data from the VidyoPortal and VidyoRouter infrastructure components and displays it on dashboards. Admin users can also access server metrics.
Understand usage
View current usage statistics and historical data for selected timeframes*.
The usage dashboards are:
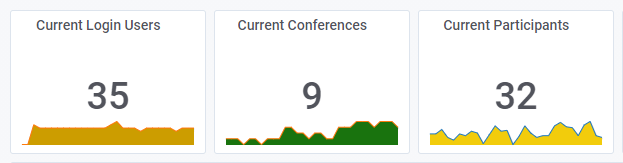
- Current status — real-time stats on the number of active users
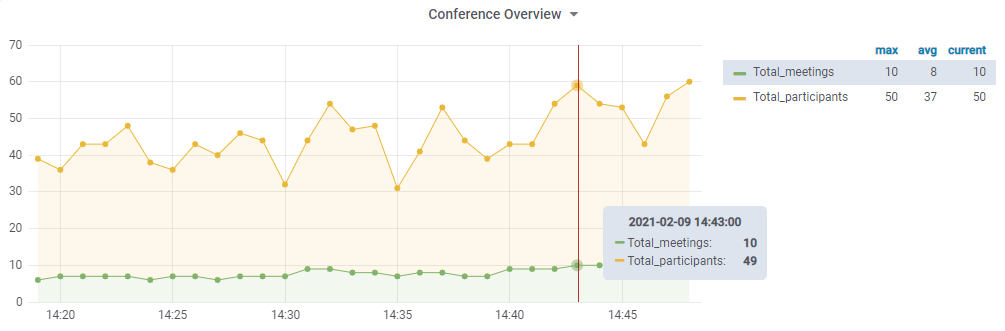
- Usage summary — historical data for selected timeframes*, including number of video or voice minutes, number of unique conferences, and number of active users
* Data snapshots are captured every 10 seconds.
Understand activity
Understand your active registered users, active endpoints, and number of calls by application.
The activity dashboards are:
- Number of Active Registered Users
- Number of Active Endpoints
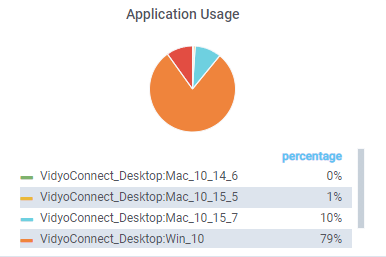
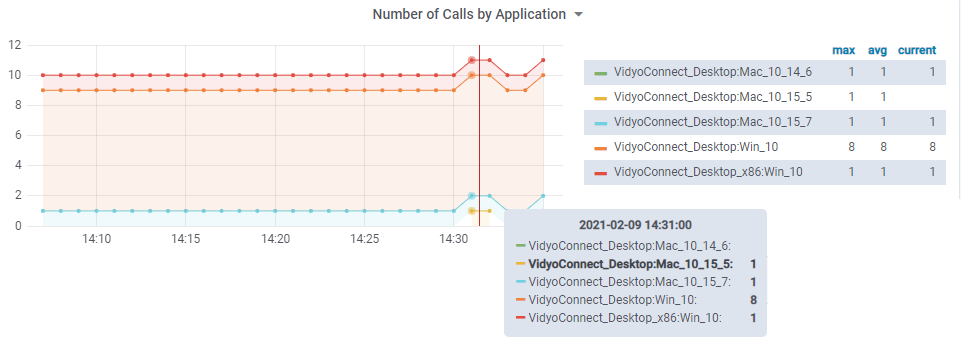
- Number of Calls by Application
- Maximum Concurrent Participants (Lines) — peak lines usage over time
Understand licensing
Monitor your license consumption for VidyoLines, client installs, and seats.
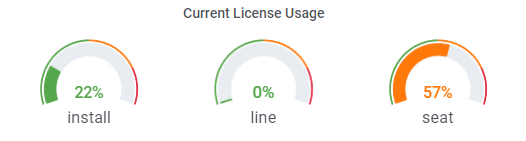
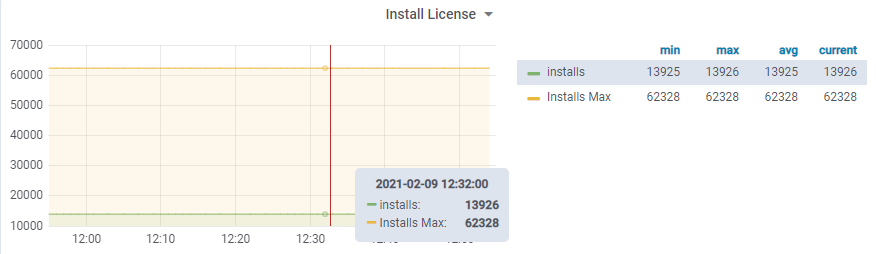
The licensing dashboards are:
- Installs — client installs license usage
- Lines — VidyoLines license usage
- Seats — seat license usage
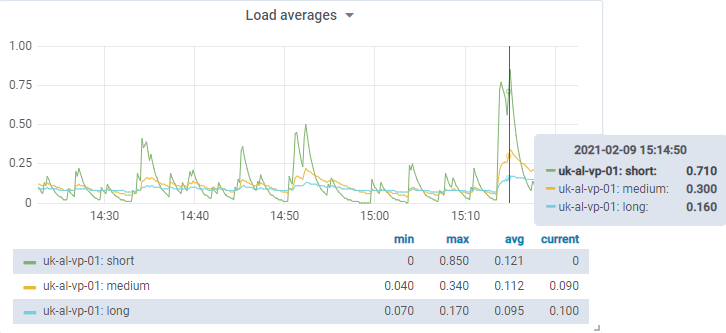
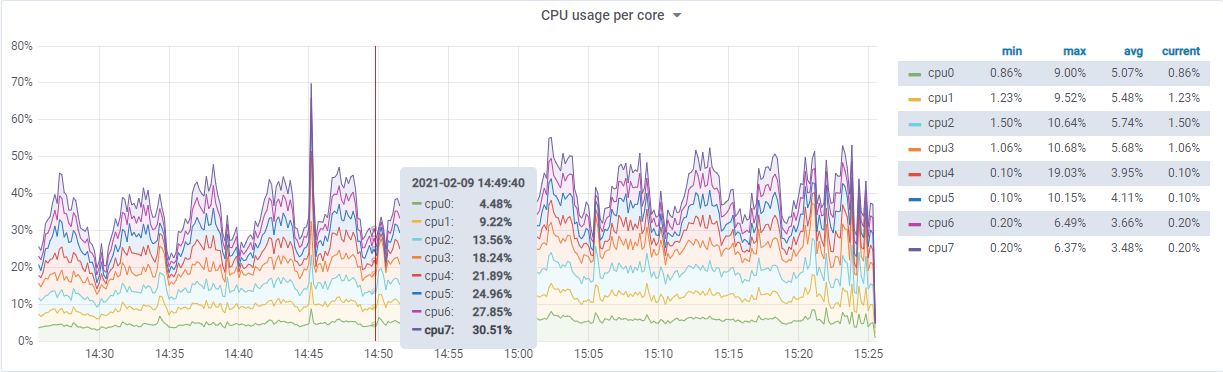
View server metrics
Analyze near real-time server-level metrics for VidyoPortal and VidyoRouter.
The server metrics dashboards are:
- CPU usage — check how processing is being used on your components over time
- Memory — monitor memory consumption of processes to determine trends
- Network — identify network issues before they impact video performance
- Disk — analyze trends of disk usage and trigger alerts
- Database — track database performance statistics to understand the impact of behaviors
- Processes — monitor key processes to understand when they may be outside of normal operation